This graph shows the hourly distribution of sleep for each day of the week. It includes both night sleeps and naps. It gives a general idea of what times a person is normally asleep during each day of the week.
The specific example below shows the sleep habits of a person between March 15th and April 4th. This person seems to go to sleep later than usual Thursday-Saturday and earlier than usual on Sunday night. The person seems to wake up between 10am and 11am most days and takes a nap in the afternoon a few times a week.
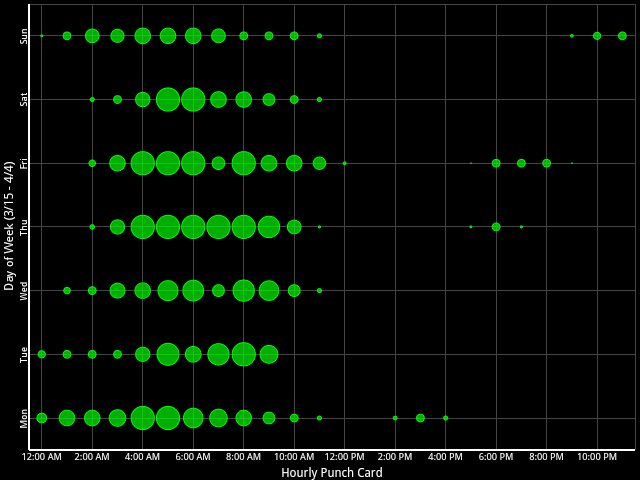
This is a relatively simple graph where a variably sized green ball appears at each hour interval for each day of the week. The size of the green balls is important where:
- no green ball at all means there are no recorded sleep periods during that time
- big green balls indicate that sleep normally occurs during that time and usually occupies the whole hour
- small green balls are indicative of one or more of the following:
- some sleep has happened during that time, but it isn't a usual occurrence (like a nap)
- sleep usually occurs during some of this hour, but not the whole hour
- for example, if one normally wakes up at 7:30 am, one can expect one's 7am green ball to be smaller than one's 6am green ball even if one is almost always asleep between 7:00 and 7:30
Notice that in the above example, the small green balls for the 7am hour on Wednesday and Friday seem strangely out of place between big green balls on either side. This is indicative of a hole occurring frequently during this time. It can happen on these days if, for example, one ends up waking up to take out the trash on these days and then returns to bed for a few hours.
Also note that all the green balls on Sunday of the above graph appear smaller relative to other days. This might be indicative of skipping sleep altogether on a particular Saturday night and Sunday morning during the computational period. Because of the short 3 week computational period in this example, one such event can have a significant impact whereas if the period was longer, it would naturally have less of an effect which would result in comparably sized balls unless the skipping of sleep entirely on a particular day is a more regular occurrence. This skipping of sleep might be a contributing factor to the early bedtime on Sunday night shown on the graph also.