The nightly duration histogram shows the frequency distribution of nightly sleep durations. That's a fancy way of saying that it shows how often one sleeps a certain number of hours in a night.
 The X (horizontal) axis shows nightly sleep durations in hours while the Y (vertical) axis shows the number of times one sleeps a particular nightly duration.
Sleep durations are not weighted for the purposes of determining which hour bucket they fall into. That means, for example, durations of 6:35, 6:57, and 6:02 all fall into the 6 hour bucket. The resultant graph may likely be skewed significantly if, for example, durations were rounded to the nearest hour. The histogram Sleepmeter produces is pure, in a sense, because each hour bucket means at least that many hours were slept.
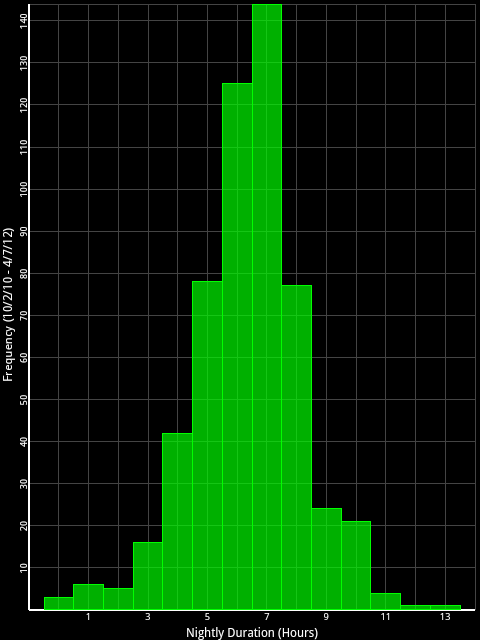
The distribution shown in the example graph at right is fairly normal (Gaussian) in nature resembling a characteristic bell curve with the most popular value in the middle and tapering downward in both directions from there.
In this example, 7 hours of sleep is the most frequent nightly duration with 6 hours close behind.
This graph has little predictive power outside of identifying the most likely nightly durations.