The Bedtime vs Duration graph shows the relationship between when one goes to bed and how much sleep one ends up getting.
A picture is worth a thousand words so, let's look at an example.
First, let's cover what all that stuff on there means:
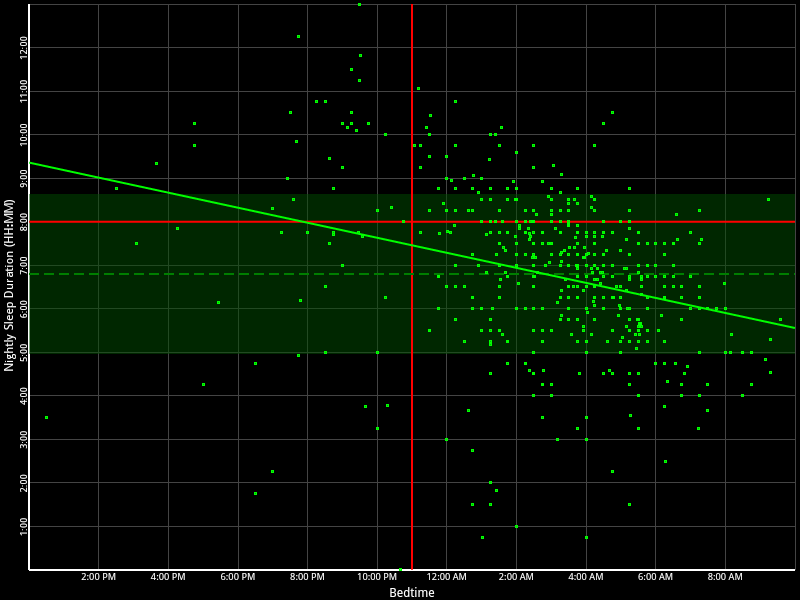
- each green dot/square represents one recorded night sleep and is plotted with the bedtime along the X axis and the duration of the sleep period along the Y axis
- the horizontal red line shows the daily sleep target as configured in the app settings (8 hours in this case)
- the vertical red line shows the target bedtime as configured in the app settings (11pm in this case)
- the dark semitransparent green box represents the standard deviation of the nightly durations in the dataset
- the dashed dark horizontal green line that goes through the middle of the standard deviation box is the nightly duration mean
- the bright green slanted line shows the trend of the data which is found by performing simple linear regression analysis on the dataset. The trend is used to predict the most likely outcome given one of the two values that make up any point in the dataset. For example, it can answer questions like "If I go to bed at 10pm, how much sleep am I likely to get?" or "If I want to get 8 hours of sleep, when should I try to go to sleep?".
So, now that we know what all that stuff means, what can we learn by applying that knowledge to the above graph:
- there is a fairly strong relationship between going to bed earlier and getting more sleep in this particular dataset
- this dataset shows that the person almost never goes to sleep at the target bedtime
- the majority of the data is confined to the lower right quadrant of the graph which means this person goes to sleep late and does not achieve the target sleep duration more times than not
- the trend line crosses the target duration line at about 8pm which might be an optimal bedtime for this person to achieve the target duration
- the trend line crosses the duration mean at about 3am, so this person should try to go to bed prior to 3am if this person wants to achieve an above average nightly sleep duration